Plot clock rate distributions
clockrate_dens_plot.RdPlots the distribution density of clock rates by clock and clade. The input must have a "clade" column.
Arguments
- rate_table
A data frame of clock rates, such as from the output of
get_clockrate_table_MrBayeswith an extra "clade" column.- clock
Which clock rates will be plotted. If unspecified, all clocks are plotted.
- stack
Whether to display stacked density plots (
TRUE) or overlapping density plots (FALSE).- nrow
When plotting rates for more than one clock, how many rows should be filled by the plots. This is passed to
facet_wrap.- scales
When plotting rates for more than one clock, whether the axis scales should be "fixed" (default) across clocks or allowed to vary ("free", "free_x", or "free_y"). This is passed to
facet_wrap.
Details
The user must manually add clades to the rate table produced by get_clockrate_table_MrBayes before it can be used with this function. This can be doen manually with in R, such as by using a graphical user interface for editing data like the DataEditR package, or by writing the rate table to a spreadsheet and reading it back in after adding the clades. The example below uses a table that has had the clades added.
Examples
# See vignette("rates-selection") for how to use this
# function as part of an analysis pipeline
data("RateTable_Means_3p_Clades")
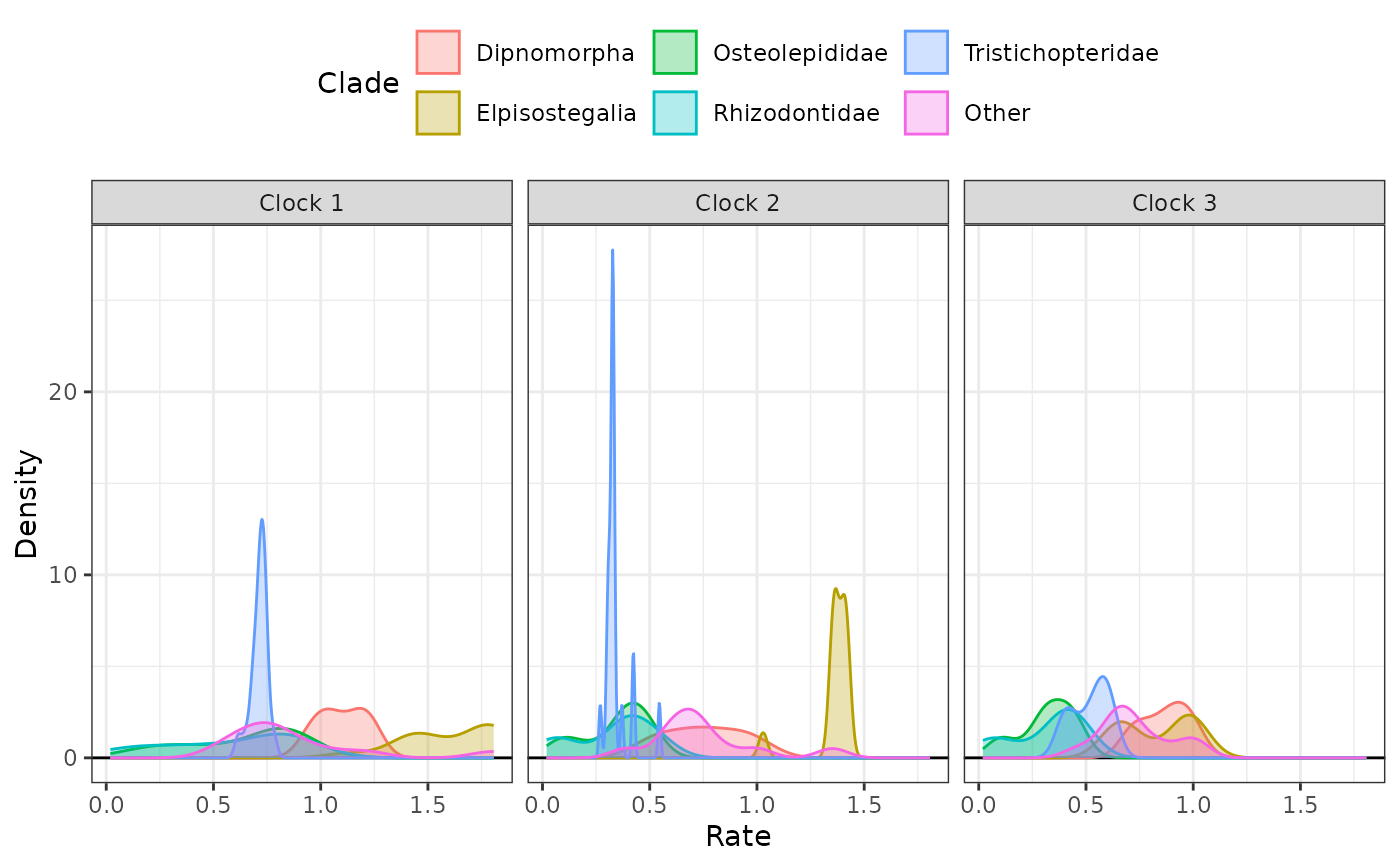
# Overlapping plots
clockrate_dens_plot(RateTable_Means_3p_Clades, stack = FALSE,
nrow = 1, scales = "fixed")
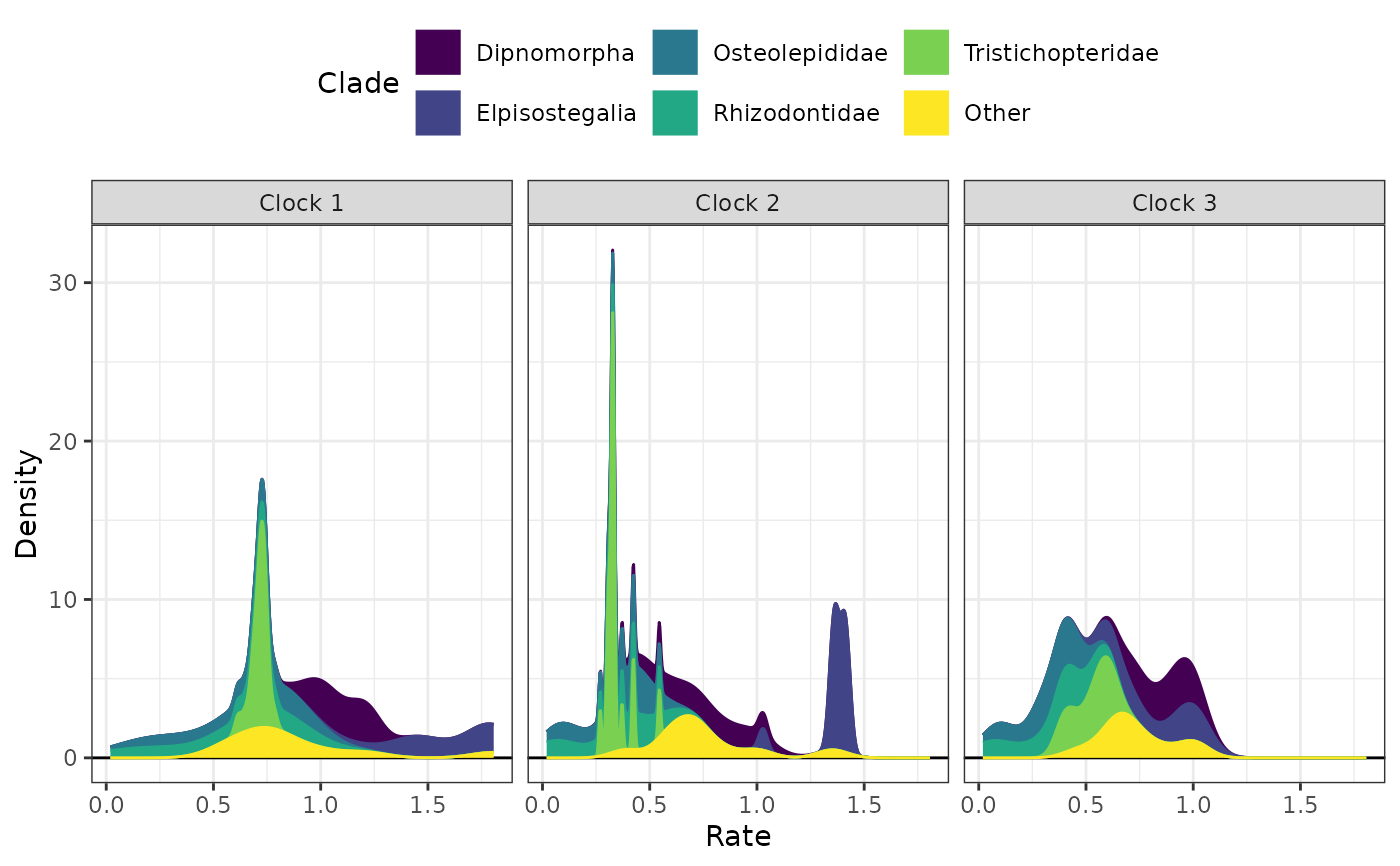
 # Stacked density for all three clocks, changing the color
# palette to viridis using ggplot2 functions
clockrate_dens_plot(RateTable_Means_3p_Clades,
clock = 1:3, nrow = 1, stack = TRUE,
scales = "fixed") +
ggplot2::scale_color_viridis_d() +
ggplot2::scale_fill_viridis_d()
# Stacked density for all three clocks, changing the color
# palette to viridis using ggplot2 functions
clockrate_dens_plot(RateTable_Means_3p_Clades,
clock = 1:3, nrow = 1, stack = TRUE,
scales = "fixed") +
ggplot2::scale_color_viridis_d() +
ggplot2::scale_fill_viridis_d()